|
|
|
|
|
|
|
|
|
|
|
|
|
|
|
|
|
|
|
|
|
|
|
|
|
|
|
|
2009 Solar Data Home Page
When you click on any of the buttons to the left you will see a day by day spreadsheet of each month's solar power generation. With each sheet you will be able to see the data in a graph format.
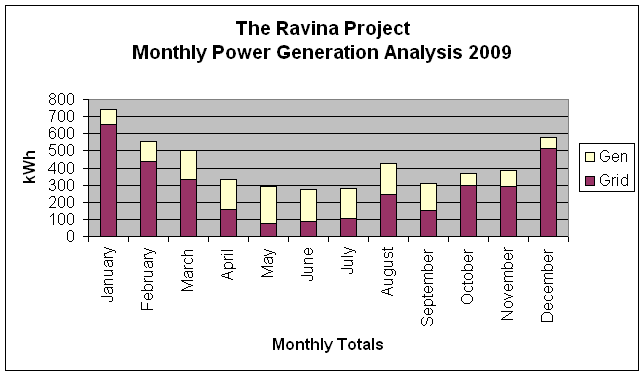
Note that the bar graphs illustrate the total power used by the house. The yellow part of the bar indicates the amount of power generated by the solar array.
Furthermore, if the bar descends below the bottom of the graph then for that day more power was produced than was used. The reading on our house meter will be less than the day before. This will occur in the summer time when we are not using air conditioning.
Below see the year to date at a glance. Gen means power generated by solar. Grid means power used from the grid. And % Gen is the electricity generated each month as a percent of the total monthly electrical power usage.
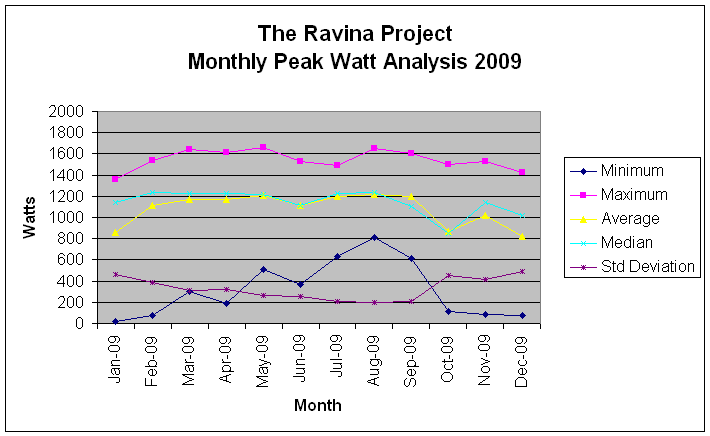
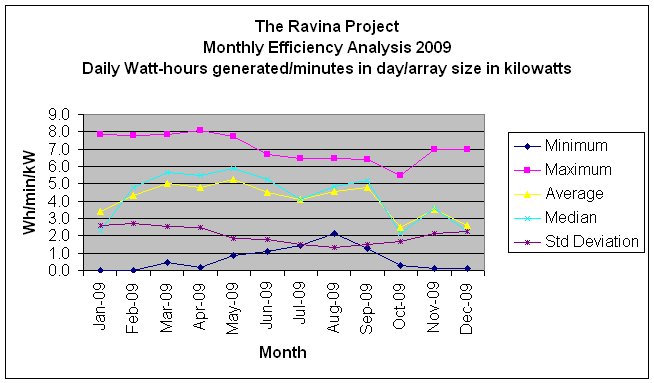
We have also added other yearly charts and graphs for the analysis of monthly peak power and array efficiency.
Yearly 2009 totals and other stats: yearly solar generation efficiency 4.2 wh/min/kW total solar generation per kW of collector 1129.8 kWh/kW average solar power generation per day 4.6 kWh/day total power generation 1694.7 kWh total grid power used 3347.5 kWh Total power sent back to grid 285 kWh percentage of total power generated 33.6% House total electrical power consumption 5042.2 kWh total gas used 2470 cubic meters yearly average gas usage / day 6.77 cubic meters average gas usage / day for heating 7.37 cubic meters total yearly power consumption from all sources 30.62 mWh house efficiency - cm used per HDD 0.51 cubic meters
Year 2009 Monthly kWh Analysis
Month Gen Grid % Gen January 89.4 651.3 12.1 February 114.6 440.8 20.6 March 167.2 332.2 33.5 April 175.9 156.1 53.0 May 215.9 76.7 73.8 June 187.3 89.5 67.7 July 173.6 104.0 62.5 August 176.7 247.8 41.6 September 162.3 150.1 52.0 October 74.3 296.1 20.1 November 92.5 291.9 24.1 December 65.0 511.1 11.3 Total: 1694.7 3347.5 33.6%

Year 2009 Monthly Peak Watt Analysis
| Minimum | Maximum | Average | Median | Std Deviation | ||
| Jan-09 | 22 | 1360 | 856 | 1142 | 467 | |
| Feb-09 | 77 | 1542 | 1118 | 1237 | 383 | |
| Mar-09 | 304 | 1644 | 1173 | 1223 | 310 | |
| Apr-09 | 188 | 1617 | 1165 | 1228 | 323 | |
| May-09 | 508 | 1656 | 1209 | 1213 | 265 | |
| Jun-09 | 367 | 1529 | 1112 | 1116 | 255 | |
| Jul-09 | 636 | 1487 | 1200 | 1223 | 204 | |
| Aug-09 | 810 | 1647 | 1215 | 1238 | 199 | |
| Sep-09 | 609 | 1603 | 1195 | 1106 | 206 | |
| Oct-09 | 114 | 1496 | 872 | 854 | 454 | |
| Nov-09 | 87 | 1531 | 1018 | 1139 | 411 | |
| Dec-09 | 77 | 1426 | 822 | 1015 | 488 |

Monthly 2009 Efficiency Analysis
| Minimum | Maximum | Average | Median | Std Dev | |||
| Jan-09 | 0.0 | 7.9 | 3.4 | 2.3 | 2.6 | ||
| Feb-09 | 0.0 | 7.8 | 4.3 | 4.8 | 2.7 | ||
| Mar-09 | 0.5 | 7.8 | 5.0 | 5.7 | 2.5 | ||
| Apr-09 | 0.2 | 8.1 | 4.8 | 5.5 | 2.5 | ||
| May-09 | 0.9 | 7.7 | 5.3 | 5.9 | 1.9 | ||
| Jun-09 | 1.1 | 6.7 | 4.5 | 5.2 | 1.8 | ||
| Jul-09 | 1.4 | 6.5 | 4.1 | 4.1 | 1.5 | ||
| Aug-09 | 2.2 | 6.5 | 4.6 | 4.8 | 1.3 | ||
| Sep-09 | 1.3 | 6.4 | 4.8 | 5.2 | 1.5 | ||
| Oct-09 | 0.3 | 5.5 | 2.5 | 2.1 | 1.7 | ||
| Nov-09 | 0.1 | 7.0 | 3.5 | 3.6 | 2.2 | ||
| Dec-09 | 0.1 | 7.0 | 2.6 | 2.2 | 2.3 |
