|
|
|
|
Solar Data July 2008
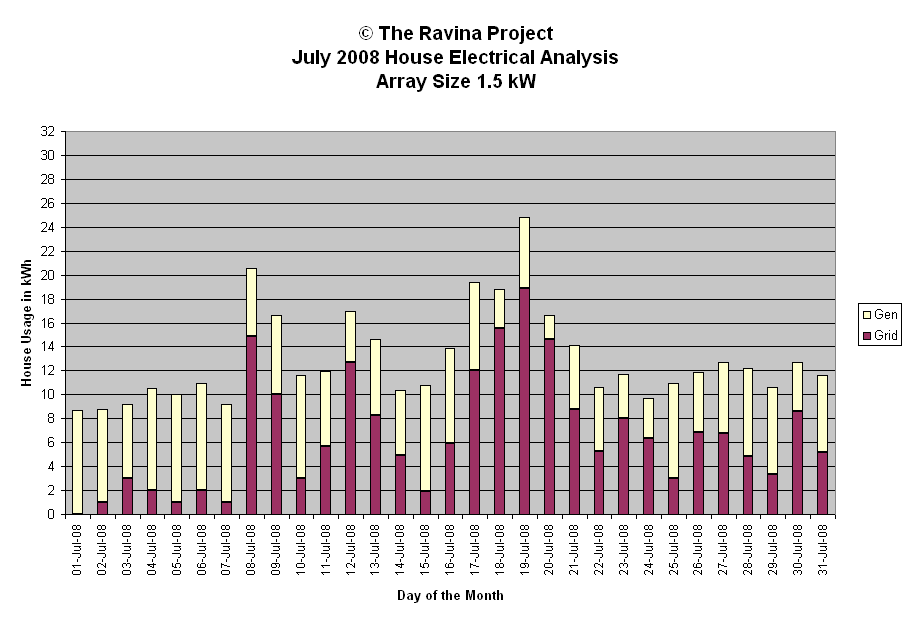
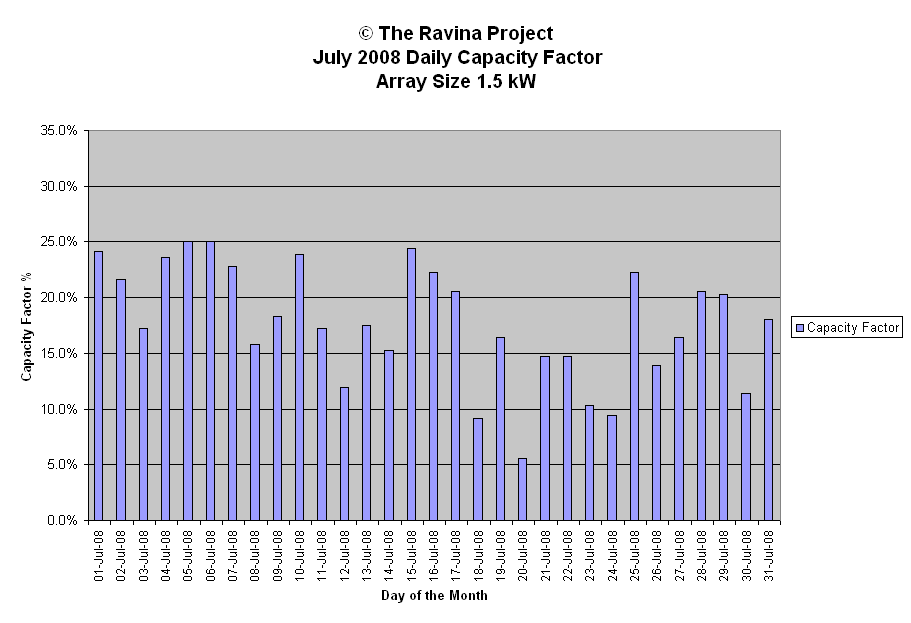
This page contains daily data and graphs of electrical energy use, the daily amount generated and Capacity Factor. Gen refers to the amount generated from the solar array and Grid is the amount we used from the grid.
| July 2008 Energy Generation Analysis | ||||||||||
| Day | kWh | Weather | Peak | Minutes | Efficiency | Capacity | Array Size | 1.5 | kW | |
| Gen | Watts | Wh/min/kW | Factor | |||||||
| 1-Jul-08 | 8.7 | sun clear | 1017 | 923 | 6.3 | 24.2% | Generation Analysis kWh | |||
| 2-Jul-08 | 7.8 | sun am oc late pm | 1125 | 922 | 5.6 | 21.7% | ||||
| 3-Jul-08 | 6.2 | oc rain am sun hz diff pm | 1244 | 921 | 4.5 | 17.2% | Total | 197.9 | ||
| 4-Jul-08 | 8.5 | sun | 1241 | 920 | 6.2 | 23.6% | Average | 6.4 | ||
| 5-Jul-08 | 9.0 | sun | 1037 | 920 | 6.5 | 25.0% | Median | 6.3 | ||
| 6-Jul-08 | 9.0 | sun | 1068 | 919 | 6.5 | 25.0% | Stdev | 1.9 | ||
| 7-Jul-08 | 8.2 | sun heat | 1044 | 917 | 6.0 | 22.8% | ||||
| 8-Jul-08 | 5.7 | oc am sun hz pm | 1072 | 916 | 4.1 | 15.8% | WX short forms used | |||
| 9-Jul-08 | 6.6 | oc br diff am sun pm | 1150 | 915 | 4.8 | 18.3% | ||||
| 10-Jul-08 | 8.6 | pristine sun pt cld | 1193 | 914 | 6.3 | 23.9% | oc - overcast | |||
| 11-Jul-08 | 6.2 | rain am sun hz pm | 1292 | 912 | 4.5 | 17.2% | diff - diffuse light | |||
| 12-Jul-08 | 4.3 | sun hz am rain pm | 1205 | 911 | 3.1 | 11.9% | brks - breaks | |||
| 13-Jul-08 | 6.3 | cld am sun pm | 1385 | 909 | 4.6 | 17.5% | br - bright | |||
| 14-Jul-08 | 5.5 | sun am oc sun late pm | 1441 | 908 | 4.0 | 15.3% | cld - cloud | |||
| 15-Jul-08 | 8.8 | sun pristine cirrus | 1018 | 907 | 6.5 | 24.4% | hi - high altitude | |||
| 16-Jul-08 | 8.0 | sun am pm cld late | 999 | 905 | 5.9 | 22.2% | hz - haze pollution or cirrus | |||
| 17-Jul-08 | 7.4 | cld early am sun hz hot | 966 | 903 | 5.5 | 20.6% | pds - periods | |||
| 18-Jul-08 | 3.3 | oc all day | 999 | 901 | 2.4 | 9.2% | pt - part | |||
| 19-Jul-08 | 5.9 | sun mod hz rain pm | 1209 | 900 | 4.4 | 16.4% | wx - weather | |||
| 20-Jul-08 | 2.0 | rain oc | 372 | 898 | 1.5 | 5.6% | sml - small | |||
| 21-Jul-08 | 5.3 | oc am sun pt cld pm | 1357 | 896 | 3.9 | 14.7% | mod - moderate | |||
| 22-Jul-08 | 5.3 | sun diff hz pt cld | 1337 | 894 | 4.0 | 14.7% | ||||
| 23-Jul-08 | 3.7 | oc rain sun late pm | 1276 | 892 | 2.8 | 10.3% | Peak Watt Analysis W | |||
| 24-Jul-08 | 3.4 | sun oc rain | 1444 | 890 | 2.5 | 9.4% | ||||
| 25-Jul-08 | 8.0 | sun pt cld | 1115 | 888 | 6.0 | 22.2% | Maximum | 1444 | ||
| 26-Jul-08 | 5.0 | oc rain am sun pt cld pm | 1258 | 886 | 3.8 | 13.9% | Minimum | 372 | ||
| 27-Jul-08 | 5.9 | sun mod hz rain pm | 1040 | 884 | 4.4 | 16.4% | Average | 1158 | ||
| 28-Jul-08 | 7.4 | sun hz oc late pm | 1178 | 882 | 5.6 | 20.6% | Median | 1193 | ||
| 29-Jul-08 | 7.3 | sun pt cld | 1222 | 880 | 5.5 | 20.3% | Std deviation | 199 | ||
| 30-Jul-08 | 4.1 | rain oc am pt sun pm | 1292 | 878 | 3.1 | 11.4% | ||||
| 31-Jul-08 | 6.5 | sun pt cld | 1287 | 875 | 5.0 | 18.1% | Efficiency Analysis Wh/min/kW | |||
| Monthly: | 197.9 | 27986 | Capacity Factor Analysis | Maximum | 6.5 | |||||
| YTD: | 1064.8 | 164620 | Minimum | 1.5 | ||||||
| Maximum | 25.0% | Average | 4.7 | |||||||
| Minimum | 5.6% | Median | 4.6 | |||||||
| Average | 17.7% | Std Deviation | 1.4 | |||||||
| Median | 17.5% | |||||||||
| Std Deviation | 5.3% | |||||||||


