|
|
|
|
Solar Data December 2013
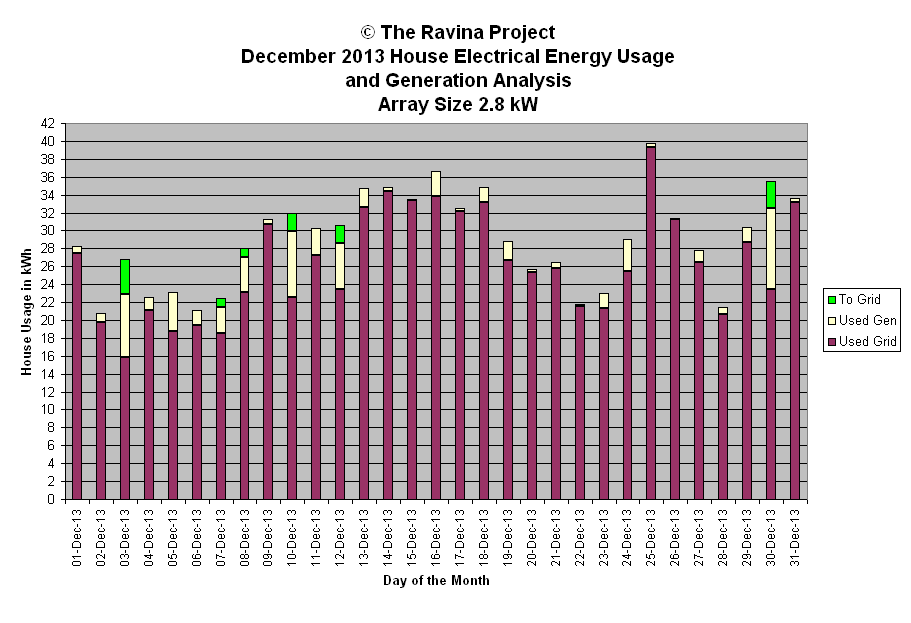
This page contains both generation data and a graph for the month.
Used Gen and Used Grid amounts in the chart show electrical energy used by the household from the solar array and the grid respectively. The To Grid amount represents the energy pushed back to the grid and not used by the household. Lots of cloud this month.
| December 2013 Energy Generation Analysis | © The Ravina Project | ||||||||
| Day | kWh | Weather | Peak | Minutes | Efficiency | Array Size | 2.8 | kW | |
| Gen | Watts | Wh/min/kW | |||||||
| 1-Dec-13 | 0.8 | oc dull | 268 | 549 | 0.5 | Generation Analysis kWh | |||
| 2-Dec-13 | 1.0 | oc dull | 323 | 548 | 0.7 | ||||
| 3-Dec-13 | 11.0 | sun AM thn cld PM | 2555 | 547 | 7.2 | Total | 82.4 | ||
| 4-Dec-13 | 1.5 | oc dull | 408 | 546 | 1.0 | Average | 2.7 | ||
| 5-Dec-13 | 4.3 | oc Am pt sun PM | 2042 | 544 | 2.8 | Median | 1.7 | ||
| 6-Dec-13 | 1.7 | oc dull | 633 | 543 | 1.1 | Stdev | 3.2 | ||
| 7-Dec-13 | 3.9 | sun cld mix cold | 3250 | 542 | 2.6 | ||||
| 8-Dec-13 | 4.9 | then cld oc mix | 2846 | 541 | 3.2 | WX short forms used | |||
| 9-Dec-13 | 0.6 | oc dull | 212 | 540 | 0.4 | ||||
| 10-Dec-13 | 9.4 | sun cld mix | 2964 | 539 | 6.2 | oc - overcast | |||
| 11-Dec-13 | 3.1 | cld AM pt sun PM cold | 1570 | 538 | 2.1 | diff - diffuse light | |||
| 12-Dec-13 | 7.1 | sun cld mix cold | 2953 | 537 | 4.7 | brks - breaks | |||
| 13-Dec-13 | 2.1 | thn cld oc cold | 1145 | 538 | 1.4 | br - bright | |||
| 14-Dec-13 | 0.4 | cld oc snow | 148 | 537 | 0.3 | cld - cloud | |||
| 15-Dec-13 | 0.1 | oc cld soa | 121 | 536 | 0.1 | hi - high altitude | |||
| 16-Dec-13 | 2.8 | pristine sun soa | 702 | 536 | 1.9 | hz - haze pollution or cirrus | |||
| 17-Dec-13 | 0.3 | oc soa | 204 | 536 | 0.2 | pds - periods | |||
| 18-Dec-13 | 1.7 | sun/cld mix soa | 1395 | 535 | 1.1 | pt - part | |||
| 19-Dec-13 | 2.2 | oc diffuse | 1222 | 535 | 1.5 | wx - weather | |||
| 20-Dec-13 | 0.4 | oc dull | 158 | 535 | 0.3 | soa - snow on array | |||
| 21-Dec-13 | 0.6 | oc dull | 181 | 535 | 0.4 | mod - moderate | |||
| 22-Dec-13 | 0.2 | oc freezing rain | 212 | 535 | 0.1 | ||||
| 23-Dec-13 | 1.7 | oc array coated with ice | 411 | 536 | 1.1 | Peak Watt Analysis W | |||
| 24-Dec-13 | 3.6 | sun soa | 1353 | 535 | 2.4 | ||||
| 25-Dec-13 | 0.4 | oc soa | 153 | 536 | 0.3 | Maximum | 3250 | ||
| 26-Dec-13 | 0.2 | sun soa | 159 | 536 | 0.1 | Minimum | 121 | ||
| 27-Dec-13 | 1.4 | sun soa | 736 | 536 | 0.9 | Average | 1046 | ||
| 28-Dec-13 | 0.8 | oc dull | 263 | 537 | 0.5 | Median | 464 | ||
| 29-Dec-13 | 1.7 | oc dull | 464 | 538 | 1.1 | Std deviation | 1058 | ||
| 30-Dec-13 | 12.1 | sun cld mix AM sun PM | 2997 | 539 | 8.0 | ||||
| 31-Dec-13 | 0.4 | cld soa | 393 | 539 | 0.3 | Efficiency Analysis Wh/min/kW | |||
| Monthly: | 82.4 | 16704 | Maximum | 8.0 | |||||
| YTD: | 1532.5 | Minimum | 0.1 | ||||||
| Yearly: | 1532.5 | 267555 | Average | 1.8 | |||||
| Median | 1.1 | ||||||||
| Std Deviation | 2.1 | ||||||||

