|
|
|
|
|
|
House Data - Electrical Energy Usage
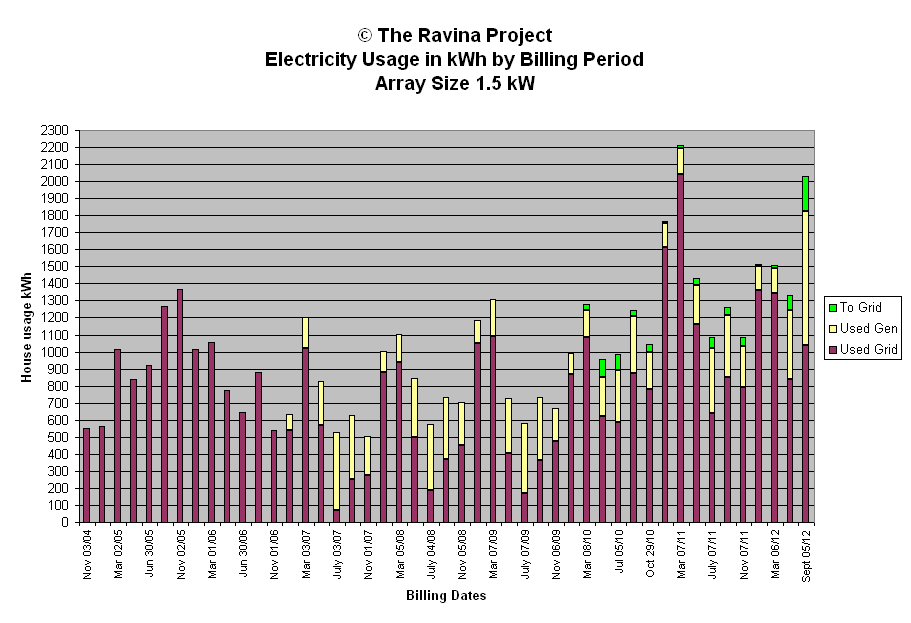
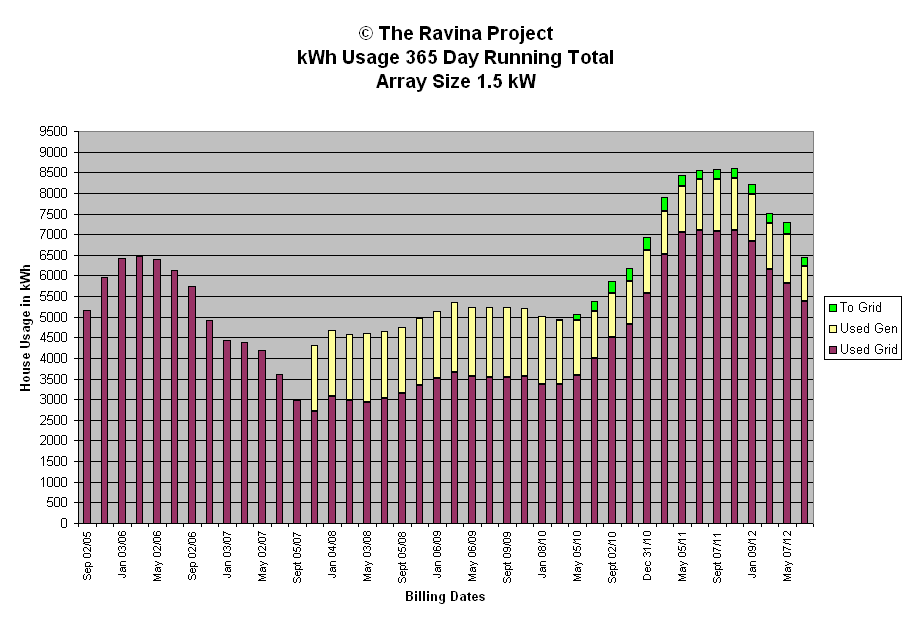
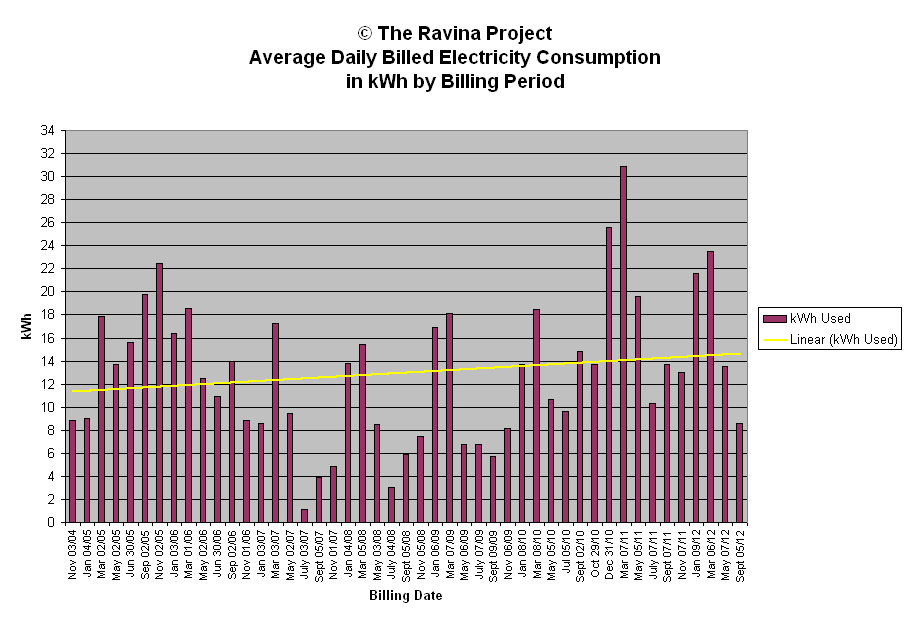
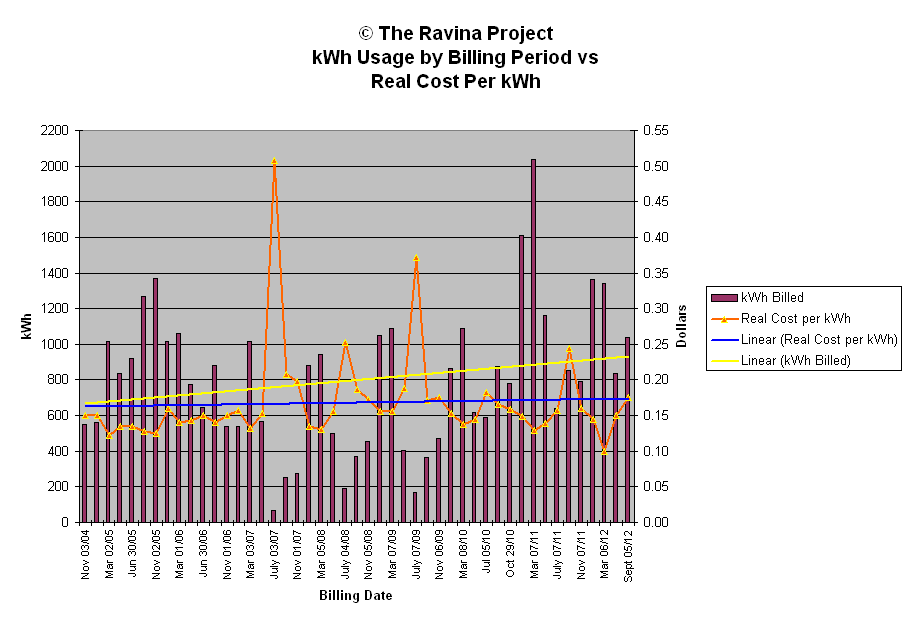
We can start to see trends in these charts. The array started producing in November of 2006. Our data was reliably collected from about that time. The first complete year of data collection was 2007. We are generating on average 1/5 to 1/3 of the electrical energy we consume.
The first billing period affected by generated power was January 03, 2007.
Note: the local utility decided to bill for 4 months in 2012 for some reason. So May through September (121 days) are bundled together rather than the usual two month billing. Only the first chart is affected by the change. It looks as if we went crazy with power usage.


